Noto Dark
Noto-Dark.RmdExamples
ggplot(cars) +
  geom_smooth(aes(speed, dist),
              method = "lm",
              color = "#2aa198",
              se = FALSE) +
  geom_point(aes(speed, dist,
                 fill = dist/speed),
             shape = 21,
             color = "black",
             alpha = 0.75) +
  theme_mps_noto_dark() +
  scale_fill_distiller("Normalized stopping\ndistance [ft/mph]",
                       palette = "RdYlBu", direction = -1) +
  scale_y_log10() +
  scale_x_log10() +
  labs(title = "Cars", subtitle = "Speed and stopping distance",
       caption = "Ezekiel, M (1930) Methods of Correlation Analysis",
       x = "Speed [mph]",
       y = "Stopping Distance [ft]") +
  theme(legend.direction = "vertical", legend.position = "right")
#> `geom_smooth()` using formula = 'y ~ x'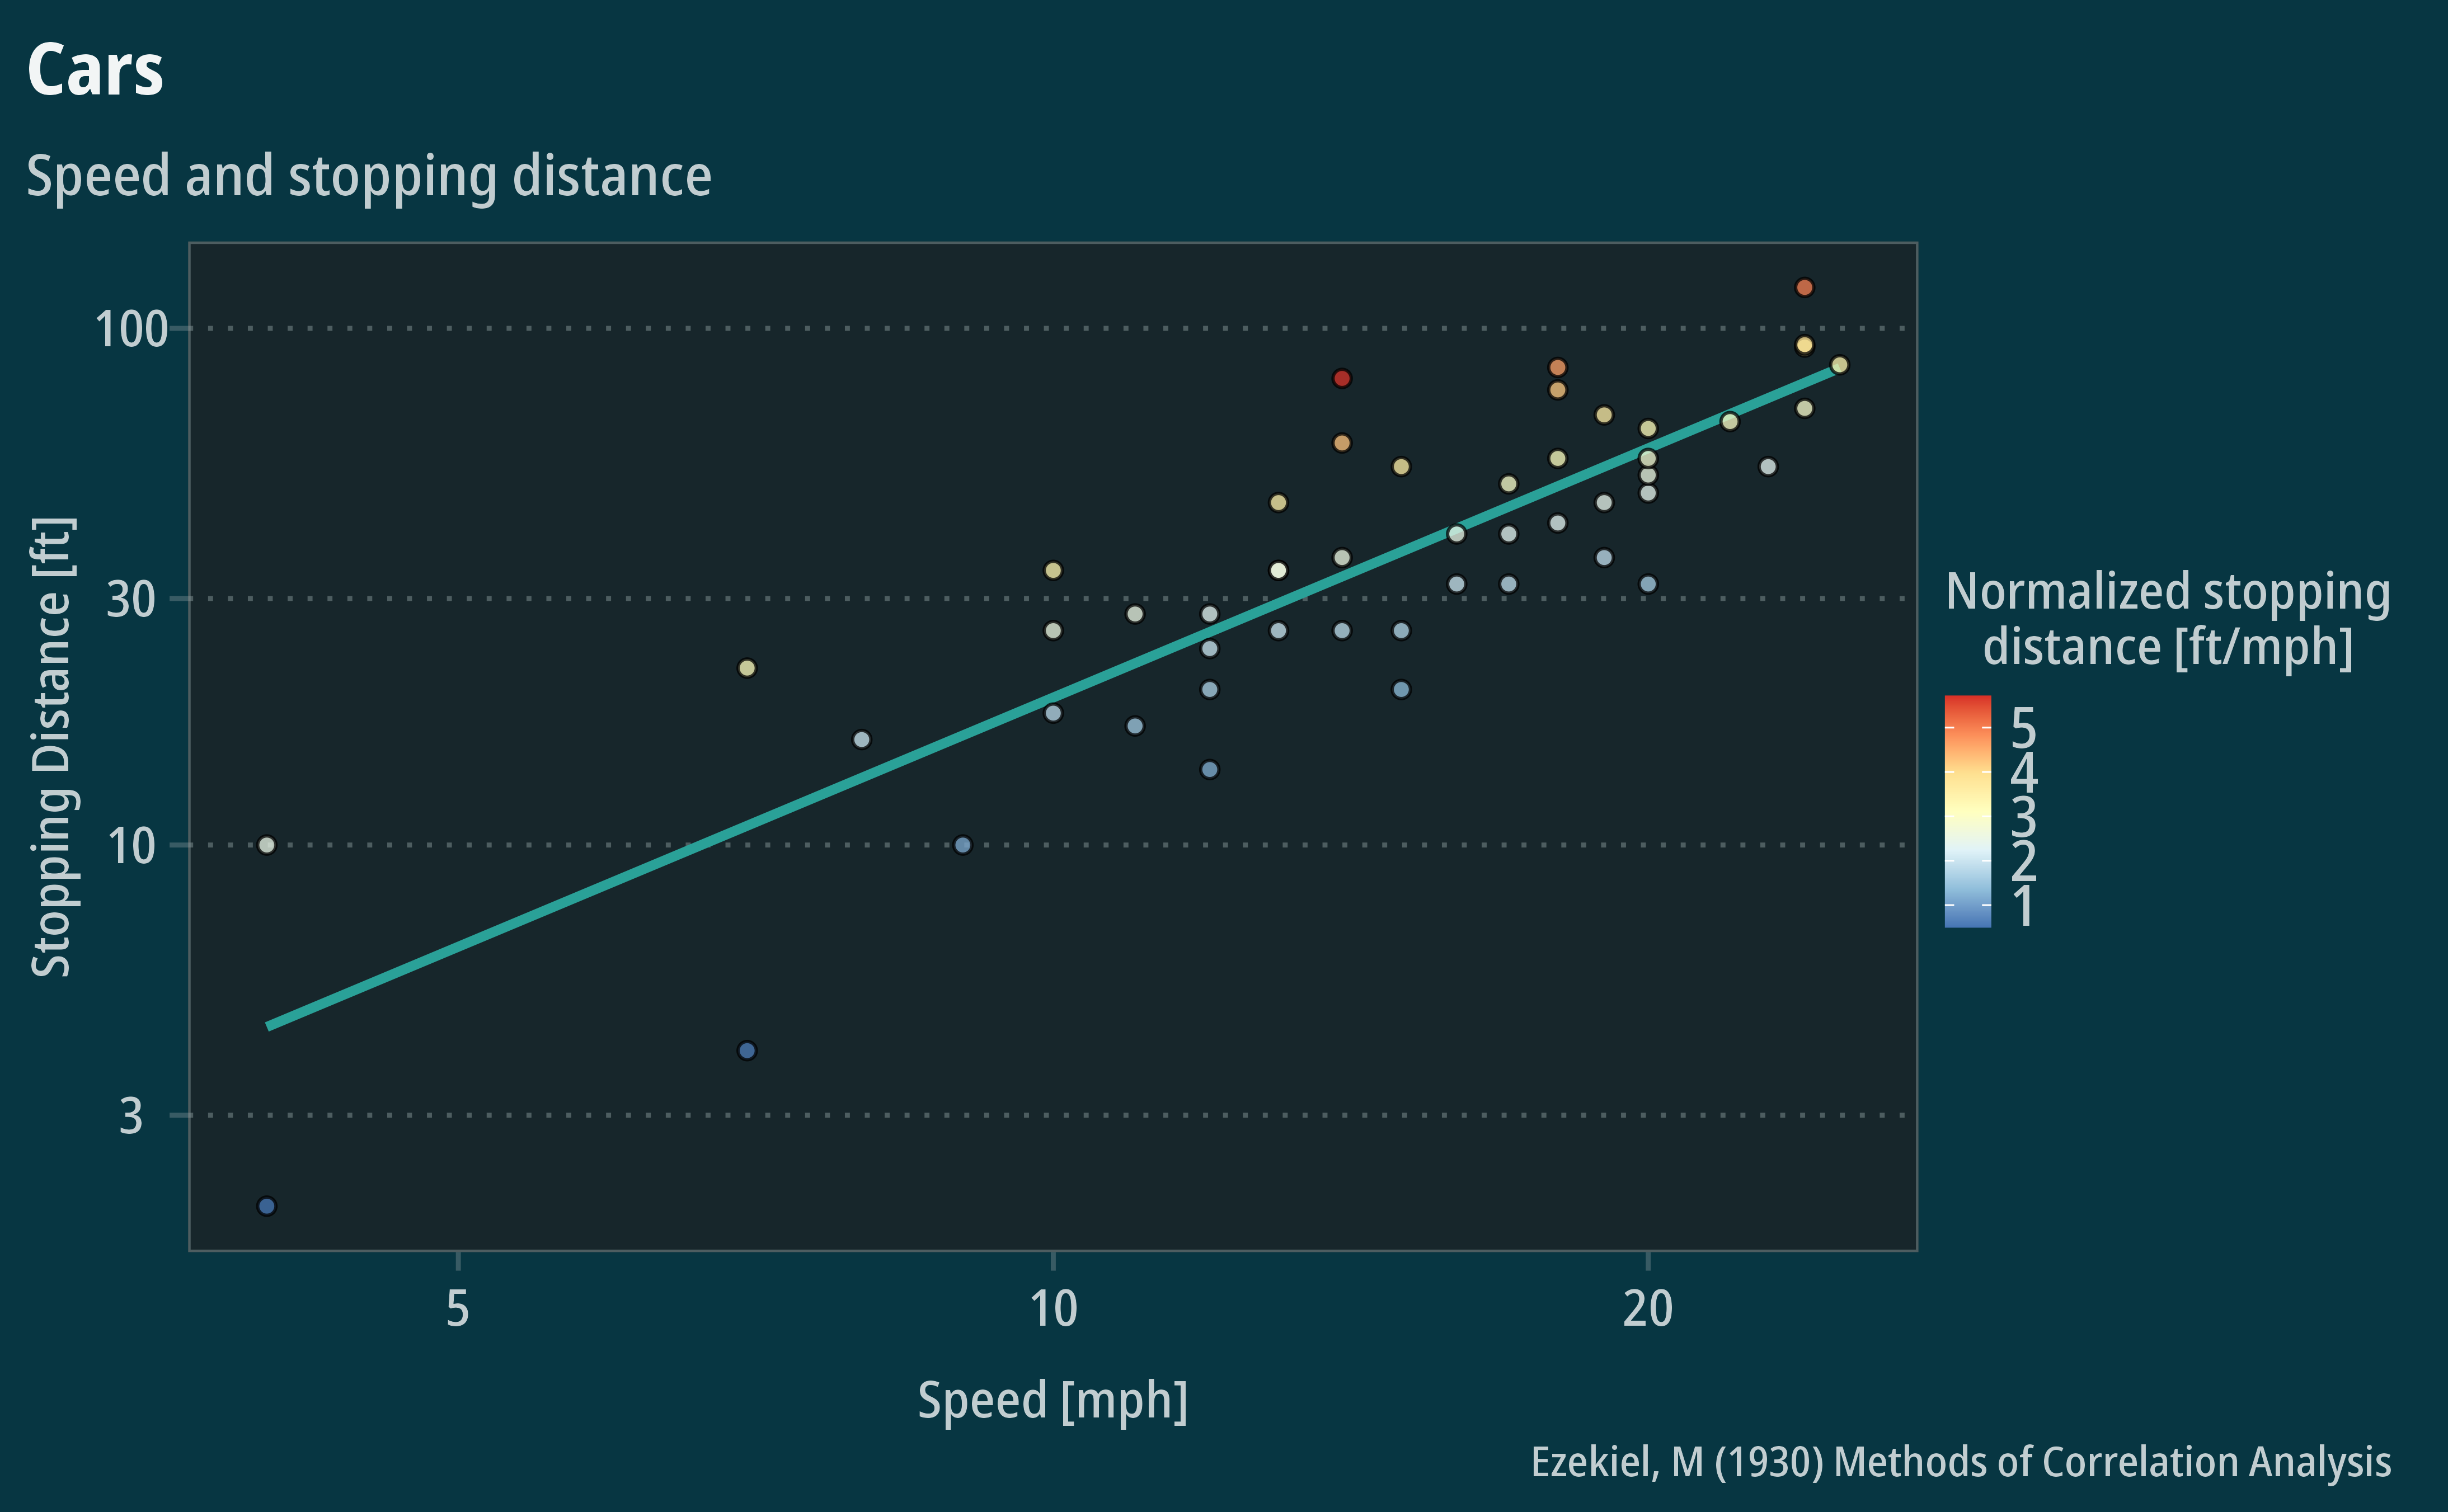
Use the shortcut function to set legible default geoms:
noto_dark_geom_defaults()


ggplot(cars) +
  geom_smooth(aes(speed, dist),
              method = "lm") +
  geom_point(aes(speed, dist)) +
  theme_mps_noto_dark() +
  scale_y_log10() +
  scale_x_log10() +
  labs(title = "Cars", subtitle = "Speed and stopping distance",
       caption = "Ezekiel, M (1930) Methods of Correlation Analysis",
       x = "Speed [mph]",
       y = "Stopping Distance [ft]")
#> `geom_smooth()` using formula = 'y ~ x'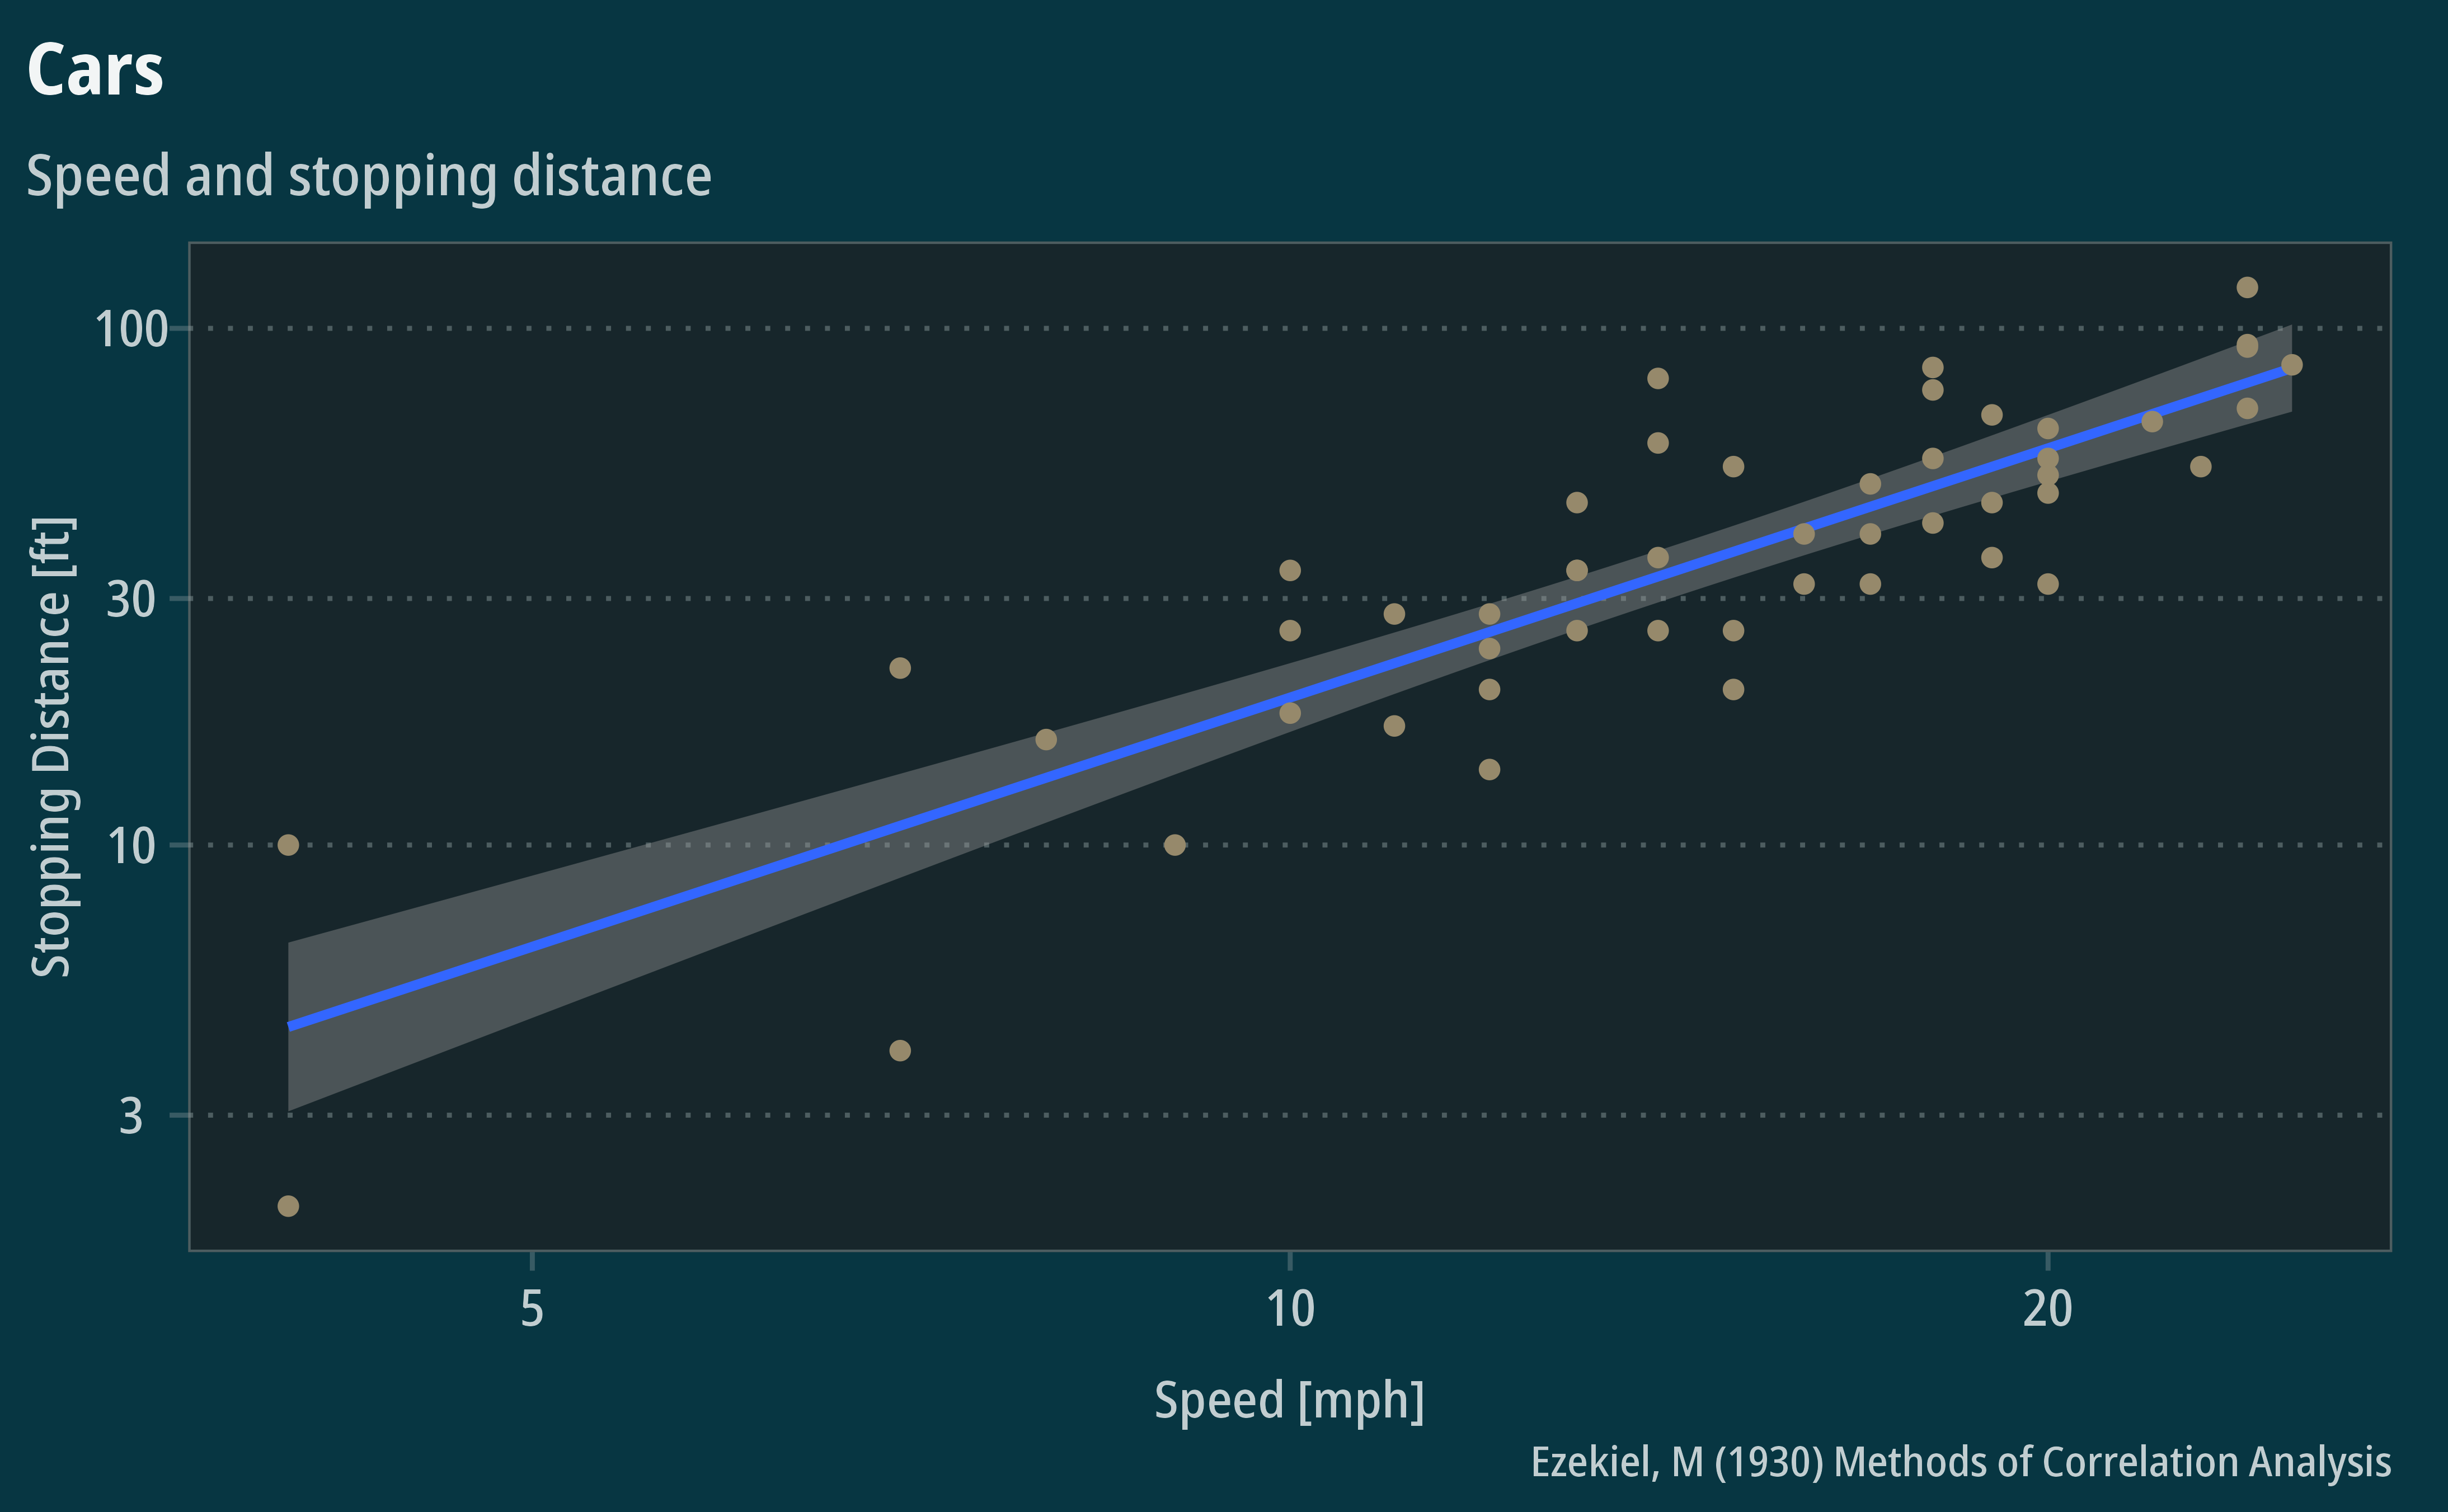
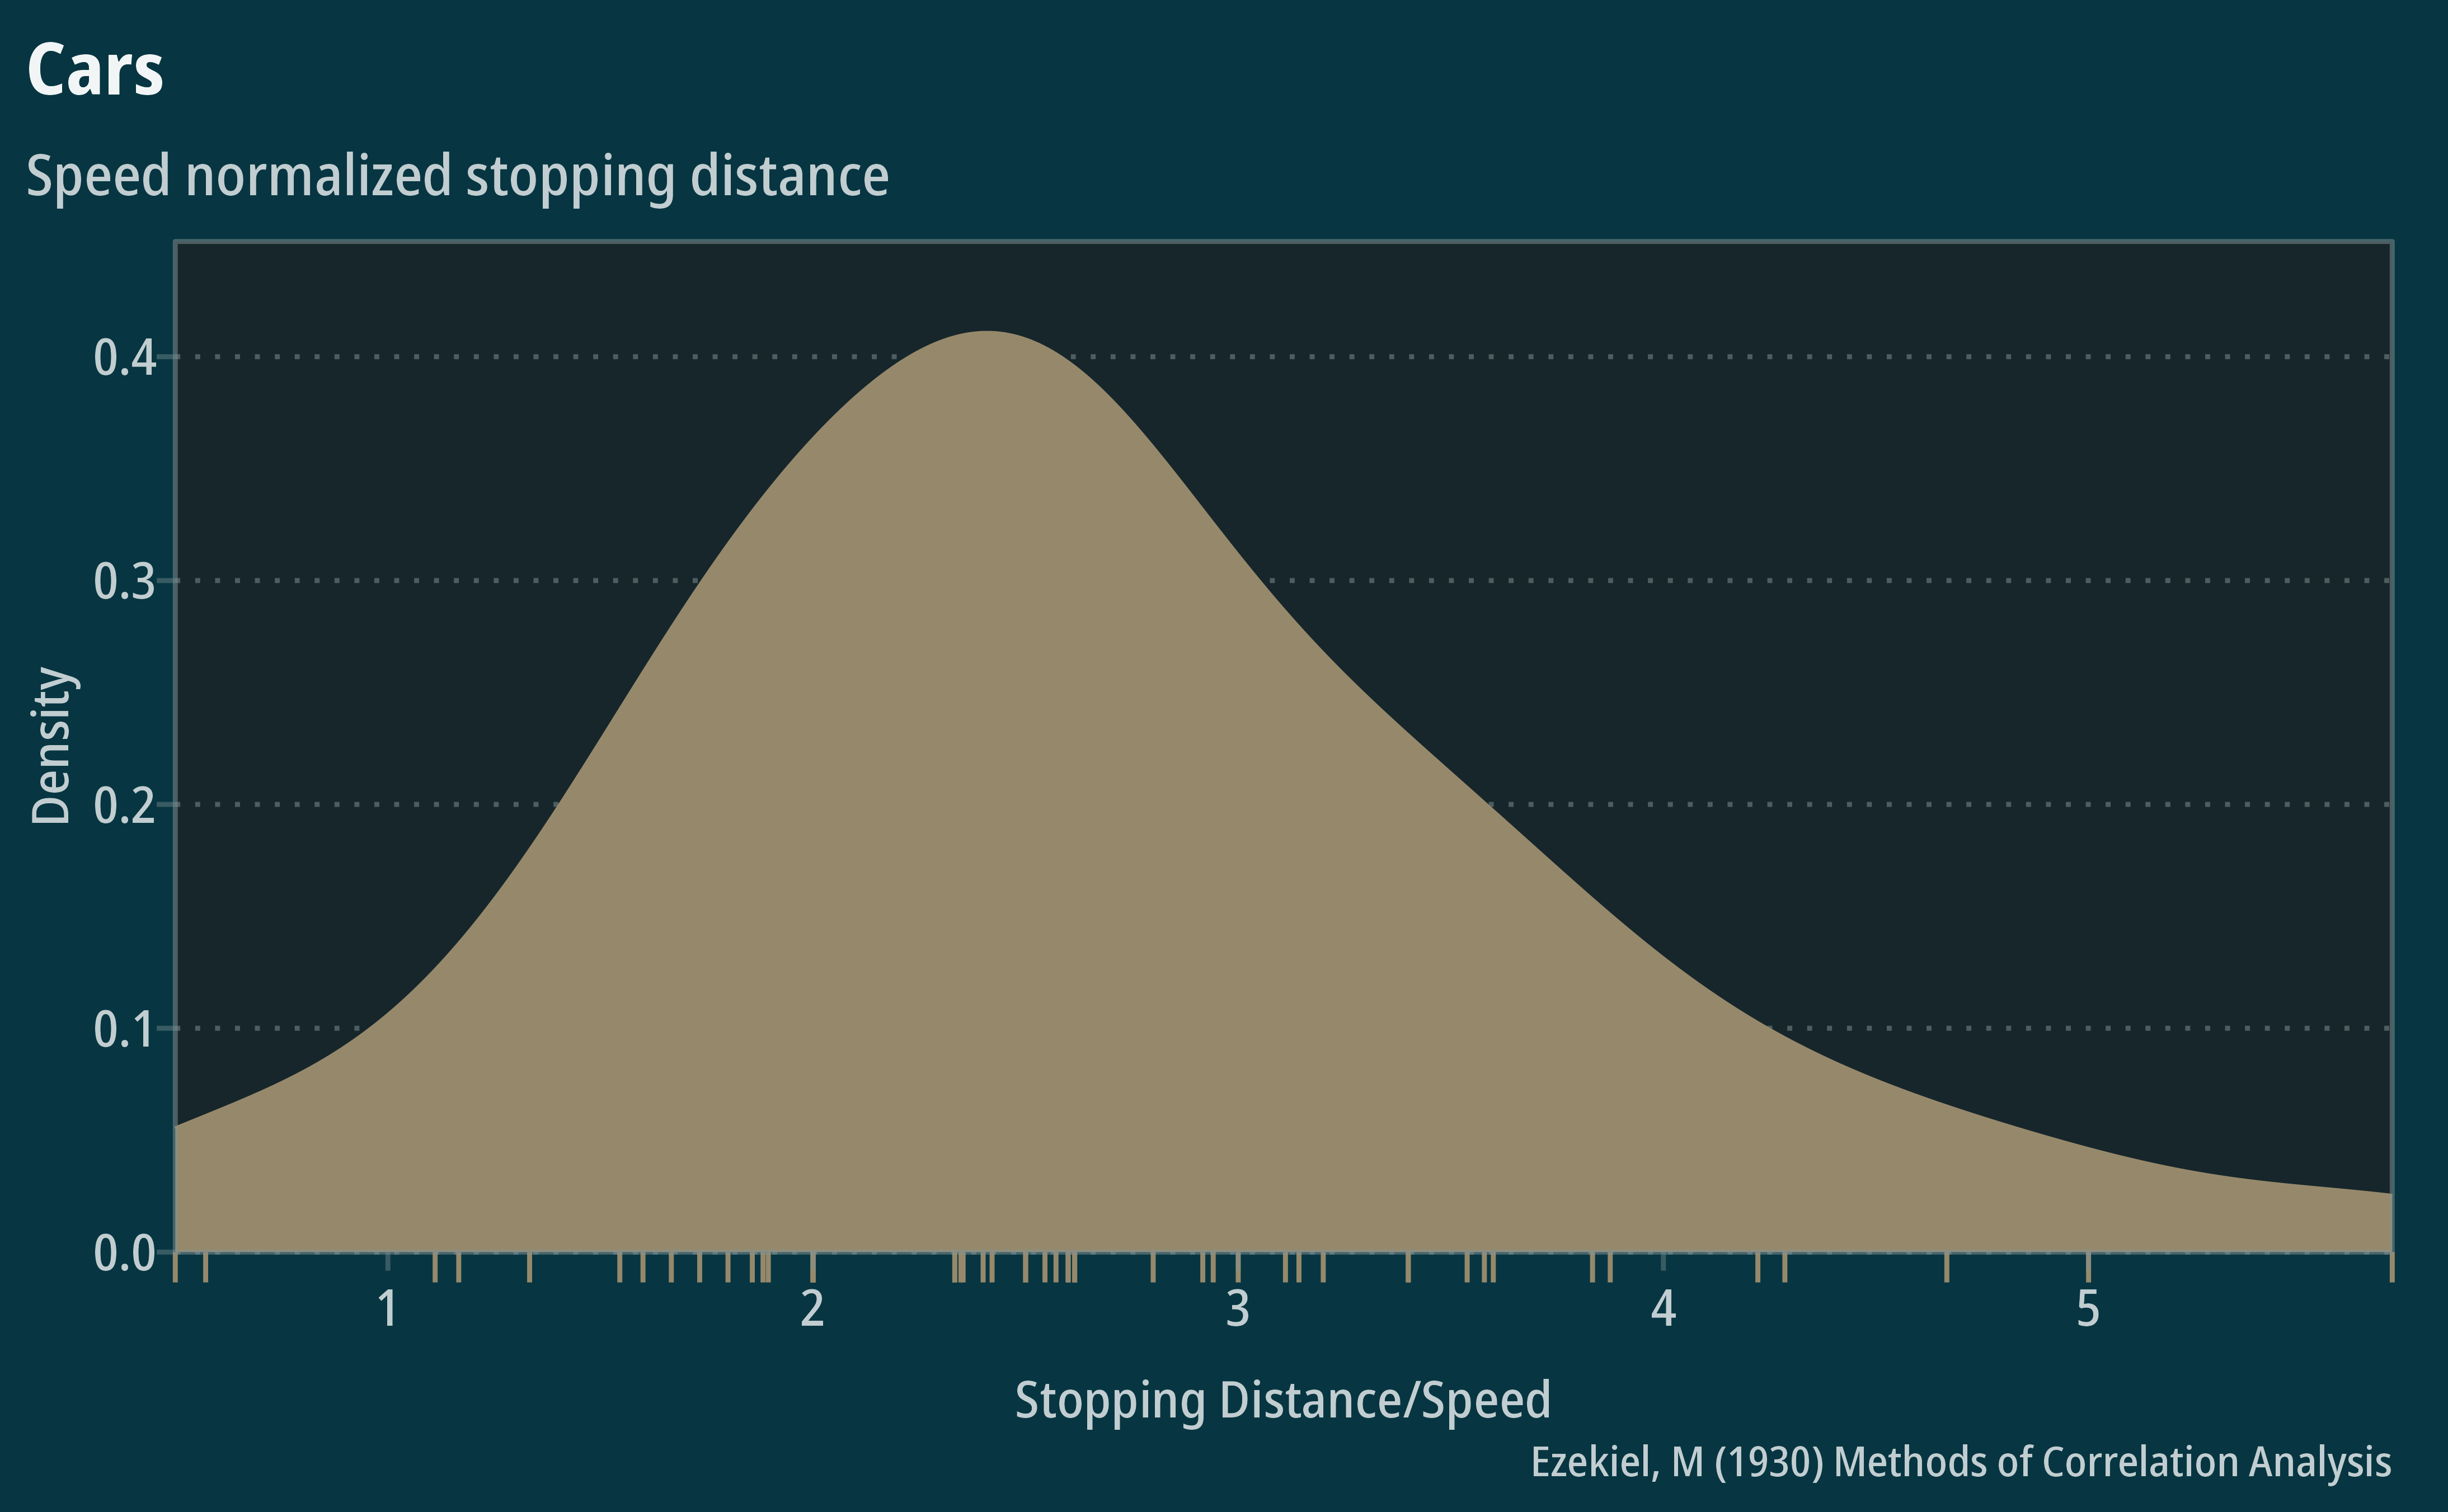
ggplot(cars) +
  geom_density(aes(dist/speed)) +
  geom_rug(aes(dist/speed), sides="b", outside = TRUE) +
  scale_y_continuous(expand = expansion(mult = c(0, 0.1))) +
  scale_x_continuous(expand = c(0,0)) +
  coord_cartesian(clip = "off") +
  theme_mps_noto_dark() +
  labs(title = "Cars", subtitle = "Speed normalized stopping distance",
       caption = "Ezekiel, M (1930) Methods of Correlation Analysis",
       x = "Stopping Distance/Speed",
       y = "Density")